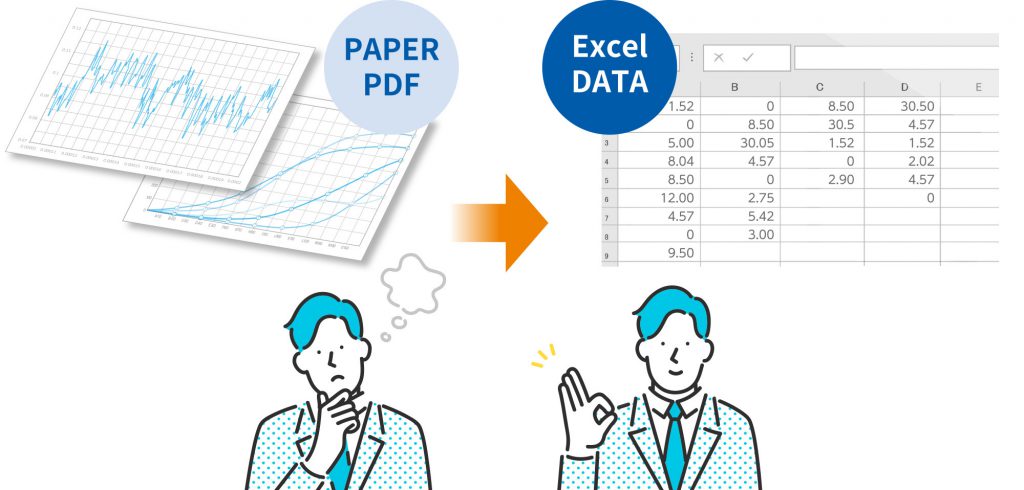
RODEM is a software that infers values from a graphic and output these data so they can easily be used and analyzed. If you have a large number of graphs that you would like to convert into numerical data, we also provide a service to perform the conversion work from start to finish.

Features
1
Quick
The function to automatically read graph frames and lines minimizes human work.

2
Precise
An evolved algorithm enables RODEM to have a highly accurate automatic reading function.

3
Easy
The intuitive interface makes it easy to operate


Why choose RODEM ?
1
Read many file format
You can read graphs from pictures with almost any extension. You can also use graphs with black background, overlapping graphs, and more.

Part specification sheet
Data sheet

Reports

Test data

Measurement results
2
Convert your data to Excel or the CSV
The data composing your graph can be output in the Excel or CSV format, making it useful for a wide range of purposes including.

Competitive Product Analysis

CAD export

Specification comparison

Analysis

Simulation
3
Used in a variety of industries
RODEM has been successfully implemented in a variety of industries, including the semiconductor and hardware design industries, where measurement results from dedicated machines are often output on paper or in PDF format.
Semiconductor

Characteristics of a component from measurement data, data sheets, etc. Can also be used to generate simulation models.
Hardware design

Obtaining part specifications, product comparisons, CAD data and more
Chemical industry

Analysis of large amounts of test data. graphs and data output from measuring instruments from one’s own company and competitors
Schools and Government

Retrieving data from old graphs and charts that are printed on paper or in books as well as getting data from an image without source
Finance

It is possible to obtain numerical data from various charts and graphs, including stock prices.

Converting graphs into numbers takes just four steps
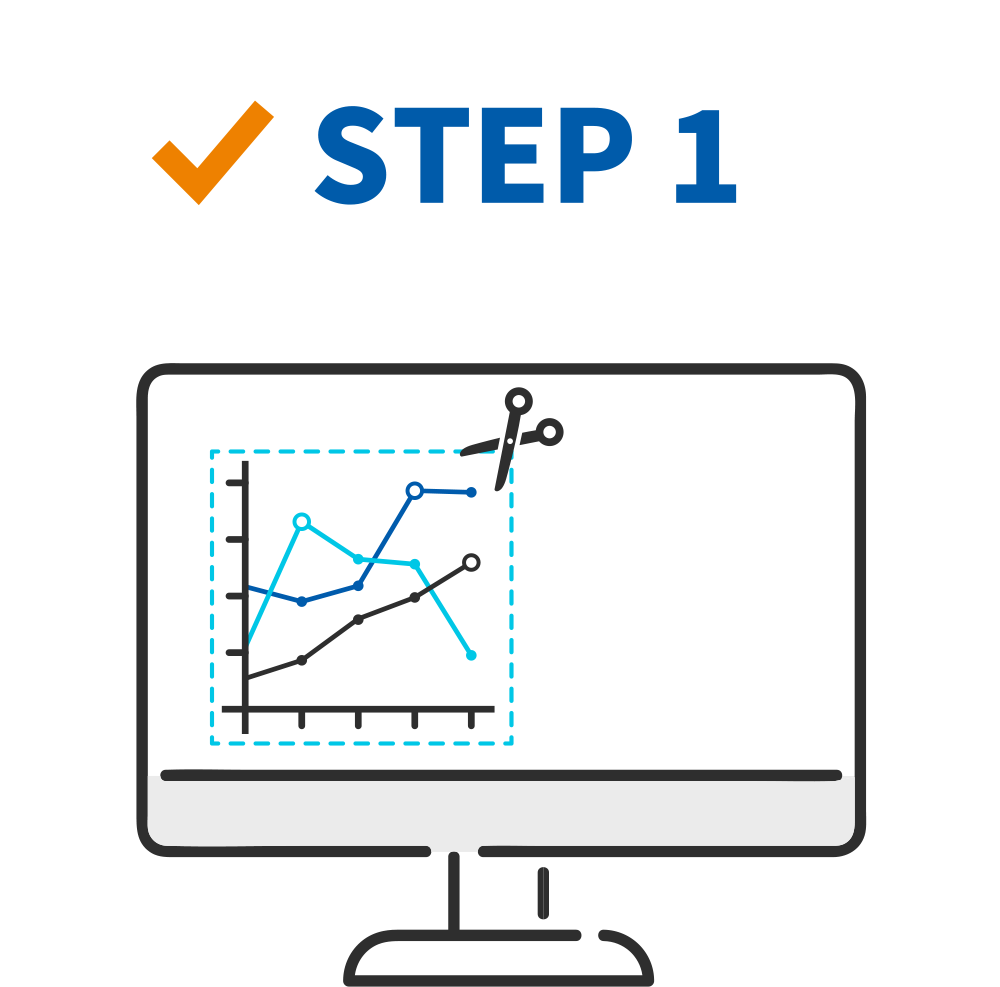
Select the graph

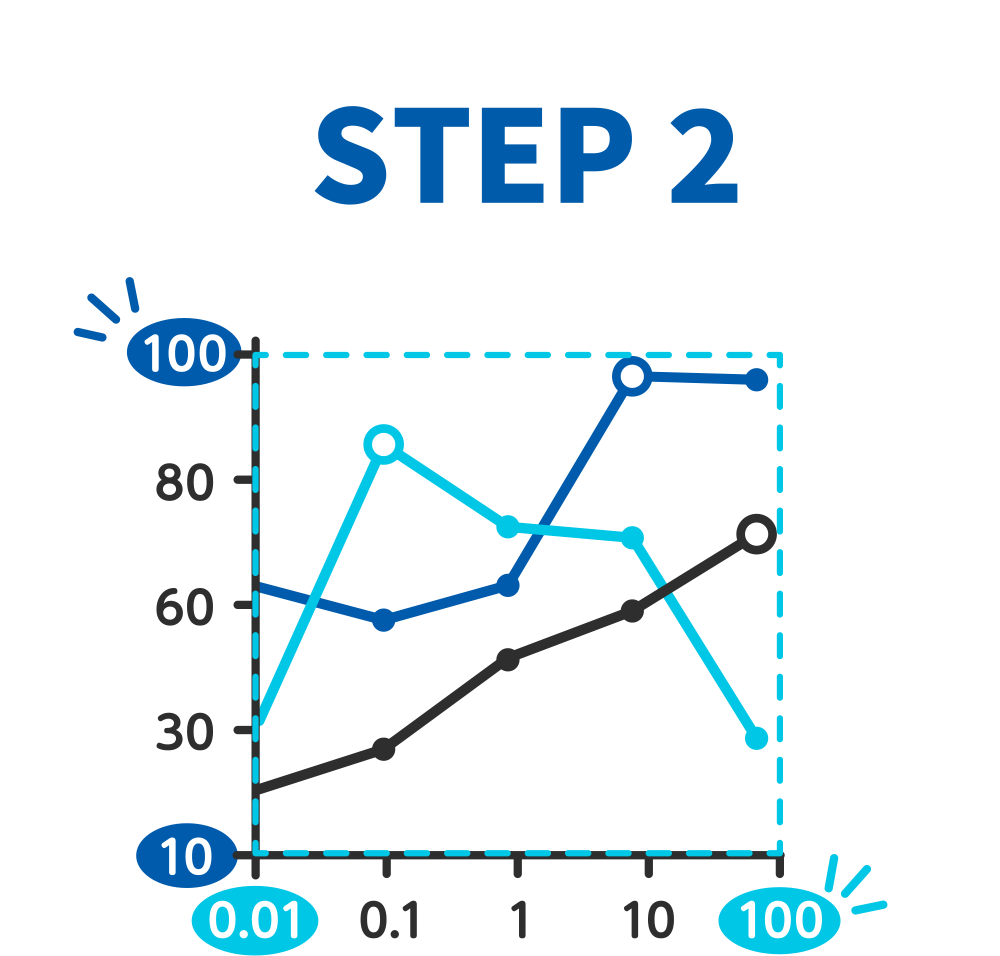
Enter the graph’s axis minimum and maximum values

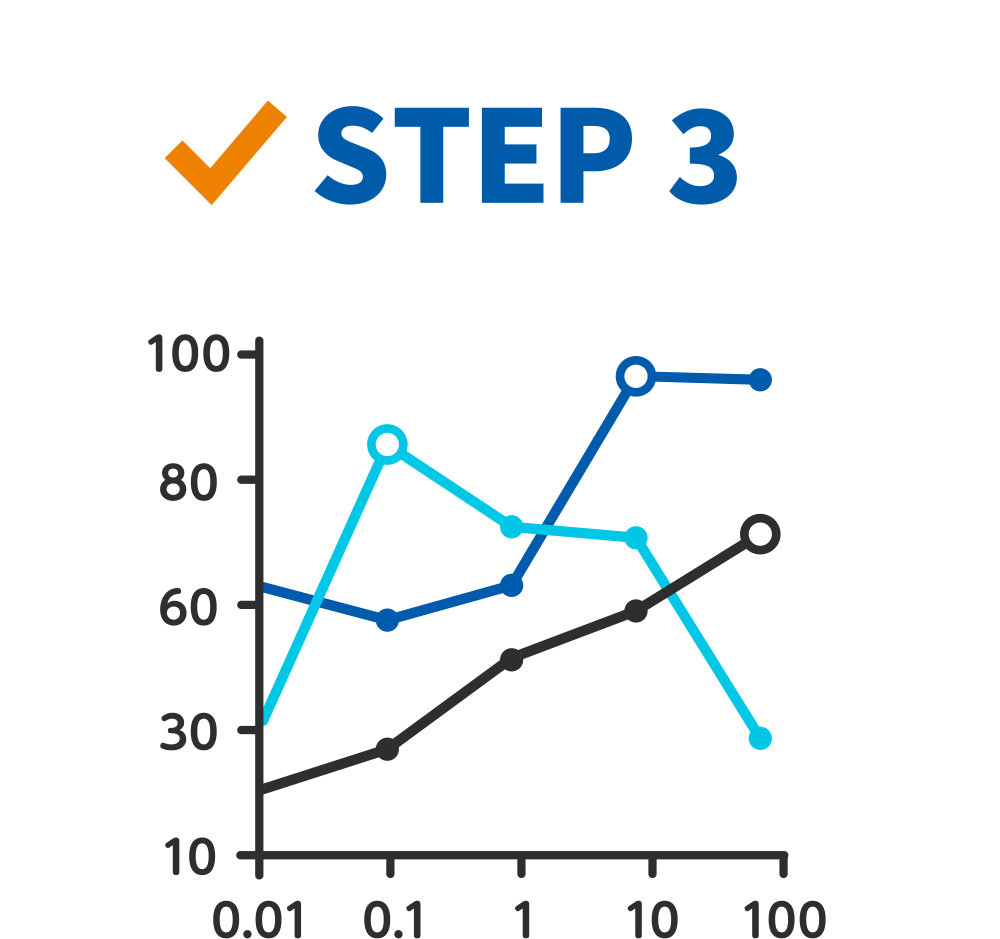
Click once on every data line

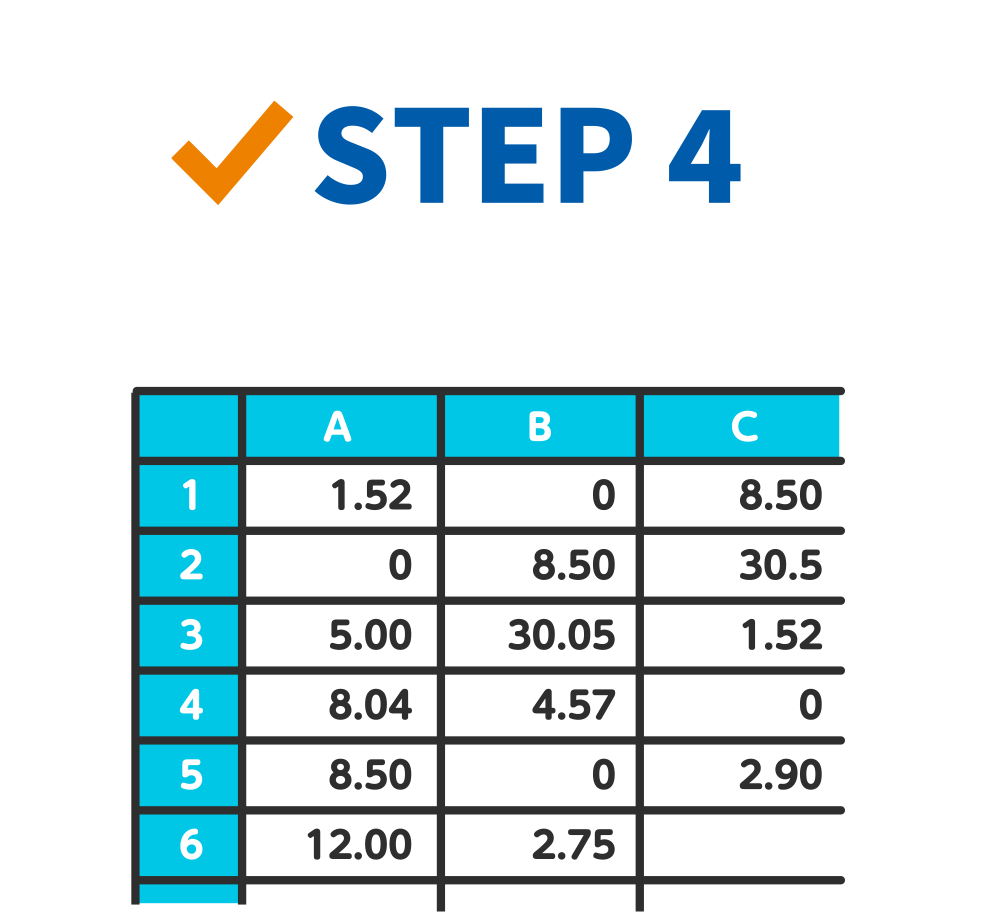
Save the result in your preferred format

 JAPANESE